

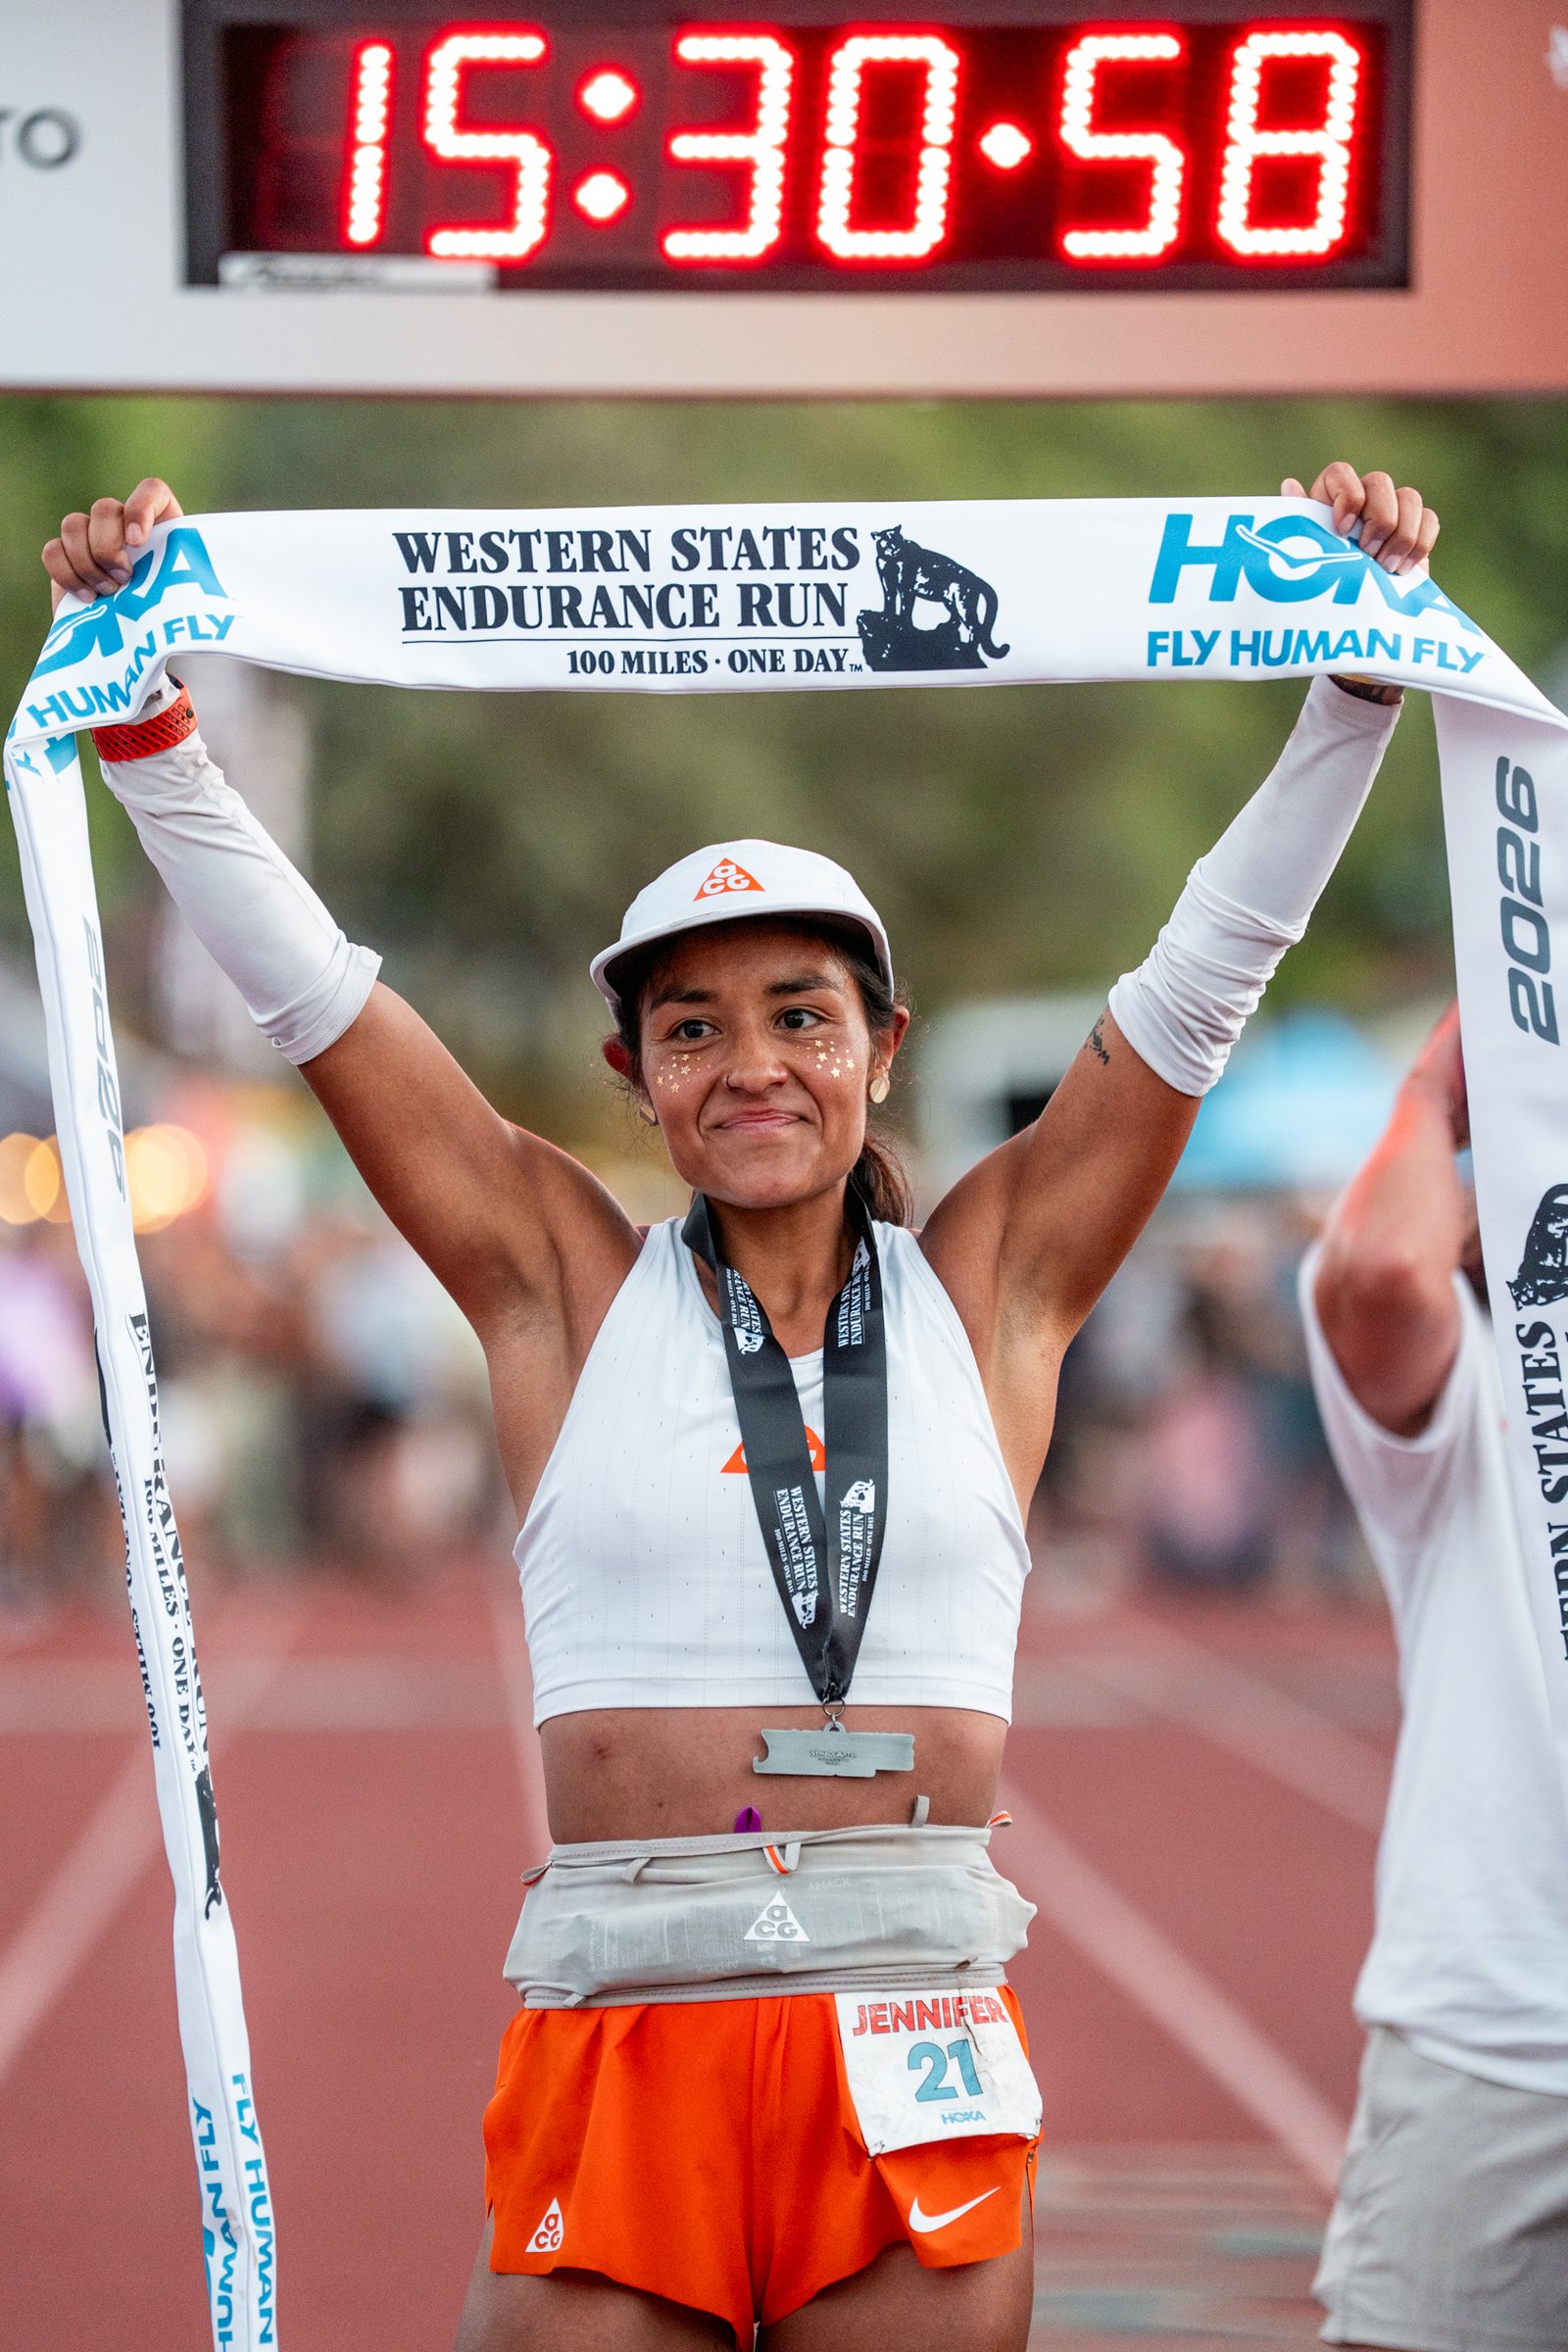
Having never raced the 100-mile distance; to call Jenn Lichter an unknown would be an understatement. Yet, she not only won the 2026 Western States 100 in 15:28:05, but set a course record.
Following the race, we reached out to Suunto asking if we could see the data pulled from her watch to get a real understanding of where she pushed, where she was forced to slow down, and see what else the numbers would reveal. Sadly, they didn’t have HR data to share, so all of the below focuses on pacing.
Through this, we matched her actual mile splits and elevation data against the known landmarks along the Western States course to understand every mile logged.
The Whole Race
- Total Time: 15:28:05 official / 15:31:47 watch duration, 15:20:44 moving time
- Recorded (watch) Distance: 99.36 mi (official course is 100.2 mi)
- Average Pace: 9’22/mi | Moving pace: 9’15/mi
- Normalized Graded Pace: 7’58/mi
For those that don’t know, Normalized Graded Pace strips out elevation and estimates what pace her effort was equivalent to running on flat ground. Absolutely crazy to imagine running 7’58 for 100-miles on a flat surface.
With a 1’24/mi gap between her raw average (9’22) and her NGP (7’58), this shows the Western States terrain cost her roughly 90 seconds per mile just in vertical change.
- Average Ascent Speed: 37 ft/min
- Average Descent Speed: 48 ft/min
- Fastest Recorded Pace: 5’11/mi
Section 1: The Escarpment and High Country (Miles 1–14)
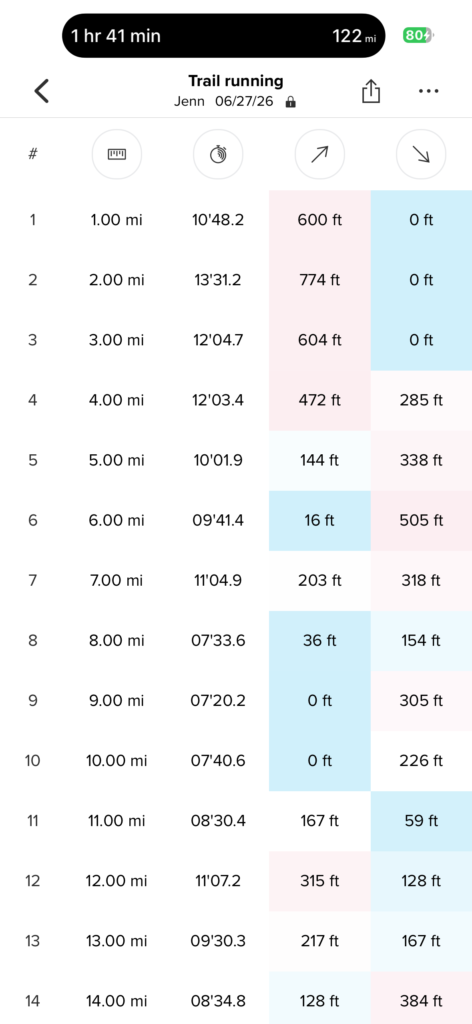
Western States opens with the hardest sustained climbing most runners will see all day: 2,550 feet up to Emigrant Pass at 8,750 feet within the first 4.5 miles.
- Miles 1 – 14: Jenn’s average pace across these opening 14 miles was 9’58/mi, or nearly 40 seconds slower than her whole-race average, which when put into perspective, was the most vertically demanding non-canyon stretch on the course. You go from zero to one thousand in effort real quick, just sheer altitude even before the legs are warmed up.
- Miles 1 – 3: Her first three full miles we’re 10’48, 13’31, 12’04; all climbing with no descending recorded.
- Miles 8 – 10: Jenn’s pace hit is stride as she descended. Her miles 8–10 clock in at 7’33, 7’20, and 7’40; a full two minutes per mile faster than the climb.
- Miles 11–14: Things got a bit choppy again (8’30, 11’07, 9’30, 8’34) as she tackled small rolling gains and losses.
Section 2: Red Star Ridge to Robinson Flat (Miles 15–27)
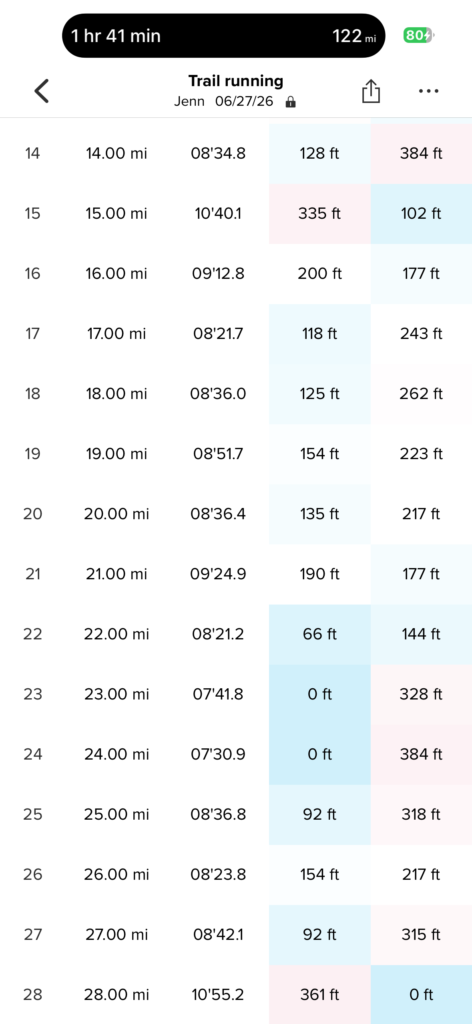
- Section Average Pace: Jenn held around 8’42/mi across 13 miles, which is faster than her opening-section average (9’58/mi). During this stretch and through our interviews and looking at the map, this is the “highly runnable” stretch of high country between the Escarpment and the canyons, which she used it to bank time before things got hard again.
- Slowest Mile: Mile 15 was done at 10’40, with 335 ft of gain, highlight a grinding, mostly hiked climb that kicks off right after Red Star Ridge (mile 15.8), before the trail settles into rolling singletrack efforts.
- Fastest Mile: This was mile 24, at 7’30, with zero recorded climbing and 384 ft of descent — this is the signature move of the section: the 2.5-mile drop from Duncan Canyon aid station (mile 24.4) down to Duncan Creek, one of the first real “open the legs” descents on the course. Mile 23 backs it up with the same pattern — 0 ft gain, 328 ft of loss, run at 7’41.
- Miles 16–22: are the choppiest stretch of her whole race so far: seven straight miles bouncing between 8’21 and 9’24 with small, constant rolling gains and losses (200/177, 118/243, 125/262, 154/223, 135/217, 190/177, 66/144). This is exactly the “series of shorter ups and downs” that course guides describe between Red Star Ridge and Duncan Canyon — nothing dramatic on its own, but the kind of terrain that quietly taxes rhythm and confidence more than any single climb does.
- Miles 25–27: flip back to climbing (92/318, 154/217, 92/315) as the trail starts the long, gradual four-mile grind up to Robinson Flat (mile 30.3) — a climb widely described as the least runnable stretch of the entire early section, where smart runners give away a little time on purpose rather than burn matches they’ll need later.
- Net Elevation: For these 13 miles, there was roughly 1,660 ft of climbing against 3,110 ft of descending, making it a net downhill.
Section 3: The Canyon Gauntlet (Miles 28–56)
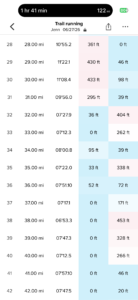
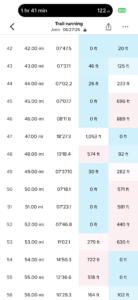
It’s said that the Gauntlet is what makes or breaks a Western States race, and this is where Jenn’s data goes through its most extreme swings but as mere mortals, we’ll never understand.
- Section Average Pace: 9’12/mi across 29 miles which is remarkably, only 10 seconds slower than her average pace for the whole 100 miles, despite this being widely regarded as the hardest terrain on the course.
- Fastest Mile: That was mile 38, and at a 6’53, this was flat and with a 453 ft decent she was flying.
- Slowest Mile of the Entire Race: At mile 47, Jenn hiked at 18’27 and for good reason, this single mile carries 1,053 feet of gain and is the climb out to Devil’s Thumb (mile 47.8), and is historically the steepest sustained climb on the course, averaging close to 19% grade, woof! But do a little bit more math and Jenn was climbing at 57 ft/minute, which is roughly 1.5x her average ascent speed for the whole race (37 ft/min). She really dug deep here and attacked it, going for the win, even though she still had 53 miles to go. And if you watched the livestream or heard her own race report, this aid station is where she strategically wanted to take the race lead and never give it back.
- Mile 48: Another 574 ft of gain in 13’18, meaning she spent over 31 minutes combined climbing out of Deadwood Canyon across those two miles alone.
- Mile 50-52: The descent to El Dorado Creek shows there was no letting up and she tackled three straight miles of pure downhill — 571, 581, and 440 ft of loss at a pace of 7’18, 7’23, and 7’46. This is also the steepest downhill on the entire course which can be a punishing drop that shreds quads which were just destroyed climbing Devil’s Thumb. And she absolutely smashed it, Incredible.
- Mile 54: From descent, Jenn then immediately hit the climb to Michigan Bluff. At 14’50 with 722 ft of gain, this was her second-slowest mile of the day, and the longest sustained ascent on the course outside the opening Escarpment. It includes back-to-back canyon crossings, and then some more grinding climbs and can be a stretch where the temperature and terrain combine to destroy paces, minds, and bodies.
Section 4: Foresthill to the River (Miles 57–78)
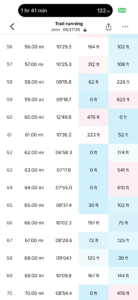
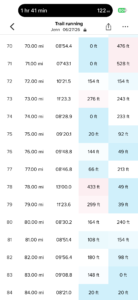
- Section Average Pace: Jenn hit these next 22 miles at 9’26/mi. This section is “essentially flat” compared to her overall race pace, despite the reputation of Cal Street as deceptively hard.
- Mile 62: Through Foresthill itself, she held 6’58, making it her fastest full mile after mile 38, and the only mile in this stretch with zero recorded climbing at all. This lines up exactly with athletes saying Foresthill is where runners find a second gear with fresh legs and a crowd behind them.
- Miles 63–64: Cal Street’s reputation holds up in these numbers with some big descents, like 541 ft and 610 ft of loss, allowing Jenn to push 7’17 and 7’55 efforts. People love to call this the elevator shaft, or a short, steep, technical plunge toward the river known for again crushing quads when you’re 60+ miles in.
- Miles 66–69: Jenn gets back into an 8’28–10’09 range as the “short, punchy climbs” show up as small gains mixed into what’s supposed to be a downhill section. This little stretch is famously described as all downhill, except for the uphill parts. LOLZ.
- Mile 78: 13’00 is a bit deceiving with 433 ft of gain and you get into the Rucky Chucky river crossing, where runners wade the American River on a guide rope, and then climb back out the far side. So understandably, this was one of the slowest miles of her whole race. This was where her closest competitor, Riley Brady, was within two minutes of Jenn. Still close!
Section 5: The Final 22 Miles
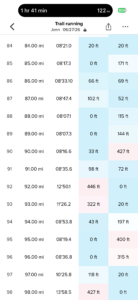
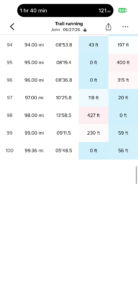
- Section Average Pace: Jenn did not slow down late and held 9’27/mi across miles 79–99. Funny enough, her pace in the final quarter of the race is statistically identical to her pace through the canyons and Cal Street, which was 13 miles earlier.
- Mile 92: In the rolling terrain of the Auburn State Recreation Area, Jenn hit 12’50 with 446 ft of gain, and at mile 93, ran at a 11’26 pace with 322 ft of gain. Given the overall pacing, this may seem slow but Jenn was now about 7 minutes ahead of her closest competitor.
- Mile 98: She secured it. Nobody was stopping Jenn at this point and at 13’58, with 427 ft of gain — the climb to Robie Point, and per her coach’s account of the race, was the exact spot where she heard she was on course-record pace.
- The Final Effort: One of the coolest things about Western States is that you finish on the Placer High School track. A ton of fandoom and people arond you. This is where Jenn just completely laid on the gas, hitting the last 0.36 miles by going 5’48.
Final Thoughts
Again. Huge thanks to Suunto for sharing this data. It’s been fun to dissect, look at, and realize we’ll never match the effort.
Before Western States, Jenn Lichter was an unknown from the United States, tackling her first 100-miler. Only Jenn and a few others truly believed she could win. And that’s the amazing part. Come in with a plan, and execute and you never know what happens.
Anyone can say Jenn Lichter had a perfect day and the data shows you what that looked like. From her 9’58/mi effort up the hardest climb of the morning, to some 6’53 miles through the canyon approach, to her final 20 miles being pace for pace, no different than her first 20, it’s all so damn impressive.
And that’s what makes the lore of Western States special.
If interested, hit up Suunto and while you’ll likely never run like Jenn, you can at least look cool.

Leave a Reply
You must be logged in to post a comment.